A React component to render a JS function as an SVG path
npm install react-function-plot
// commonJS...
var Plot = require('react-function-plot');
// ...or es2015
import Plot from 'react-function-plot';

<Plot
  className='myPlot'
  fn={myFunction}
  thickness={4}
/>
The SVG element will autosize (and auto-center) within the Plot component. (The SVG container must be a square, so the height and width of the SVG element will be set to the lesser of the height and width of the Plot component)
fn can be any JavaScript function that takes a single numeric argument...
// es5
function(t) {return 0.9/t}
// es2015
x => x * x
// or even
n => Math.random();
className is a required prop – it allows multiple Plot components to be used on the same page.
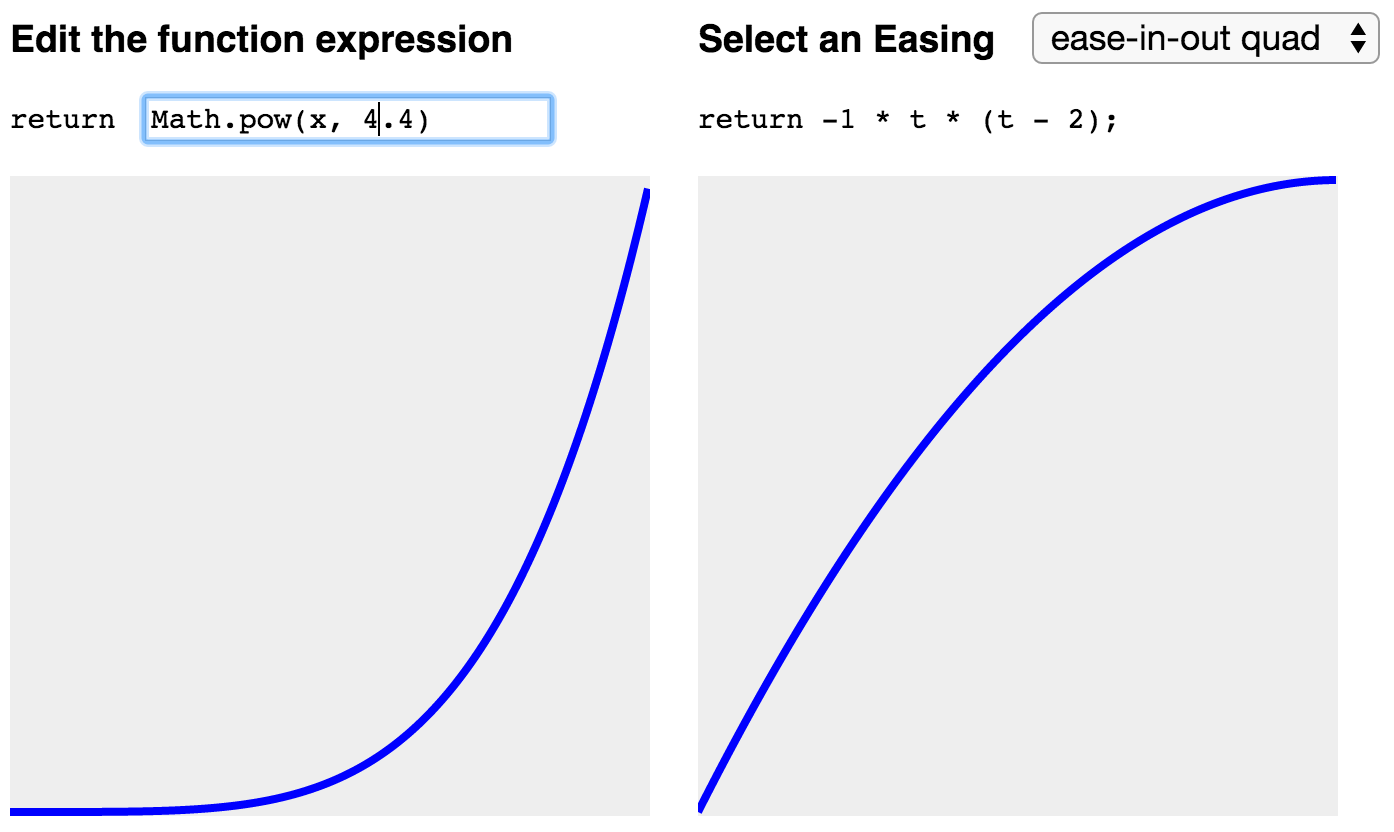
Click here to play with a working example. Here's the source for the example component.
npm test
(test coverage very limited so far)